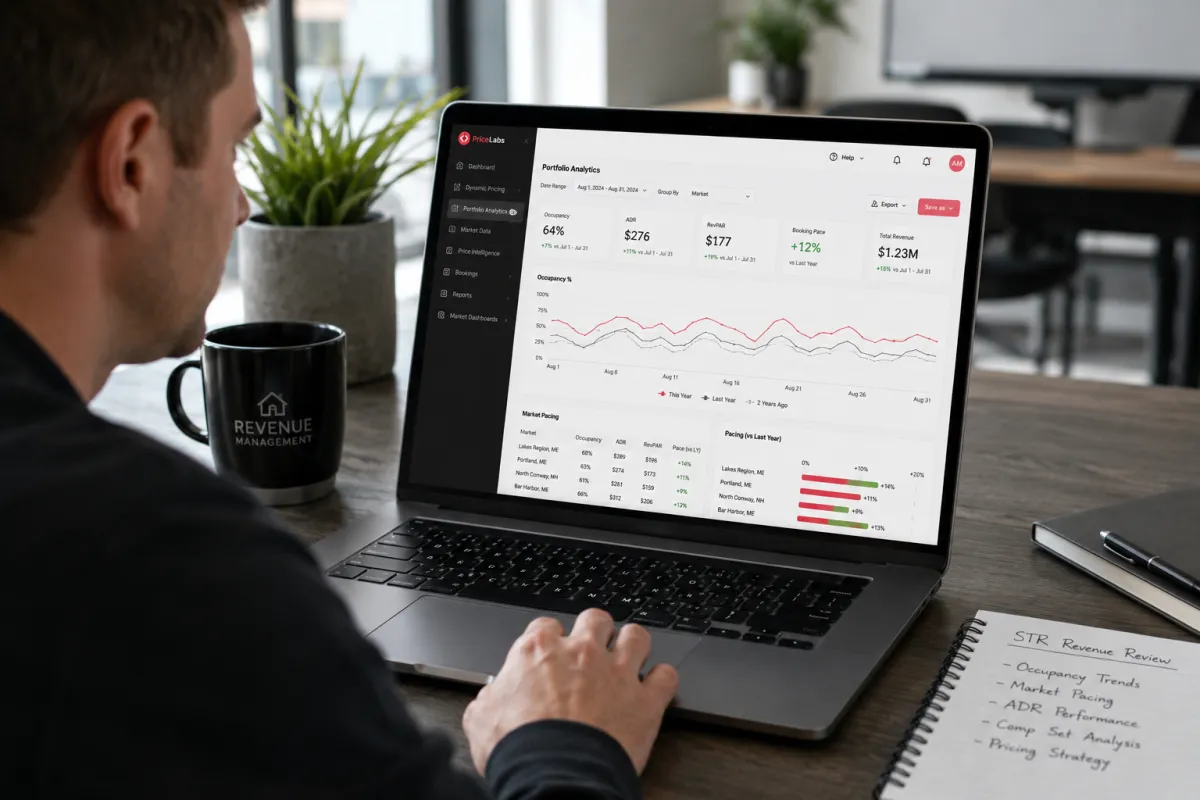
How Top Revenue Managers Use Neighborhood Data to Make Pricing Decisions
How Top Revenue Managers Use Neighborhood Data to Make Pricing Decisions
One of the biggest differences between a host and a revenue manager is how they interpret data.
Many operators open a pricing dashboard, check their rates, and make adjustments based on instinct.
Revenue managers approach things differently.
They start by asking:
What is the market doing?
How is my property pacing?
What is occupancy telling me?
Where is demand headed?
Which revenue lever should I pull next?
Those answers often start inside one tool: Neighborhood Data.
In a Revenue Academy training session, Emile and Adam Blott demonstrated how experienced revenue managers use PriceLabs Neighborhood Data to make pricing decisions, evaluate performance, and plan for both short-term and long-term revenue opportunities.
The lesson was simple:
Neighborhood Data is not just a reporting tool.
It is a decision-making tool.

Stop Looking at Prices in Isolation
One of the most common mistakes operators make is evaluating pricing without context.
A nightly rate might feel too high.
It might feel too low.
But without understanding the surrounding market, those opinions are meaningless.
Revenue managers rarely ask:
“Is this price good?”
Instead, they ask:
“Is this price appropriate relative to demand, occupancy, booking pace, and revenue targets?”
Neighborhood Data helps answer that question.
By comparing your property against nearby listings and historical performance, you can see whether your rates are aligned with market realities rather than personal assumptions.
Understanding Nearby Listings vs Market Dashboards
One of the first concepts discussed during the session was the difference between Nearby Listings and Market Dashboards.
While both provide valuable information, they serve different purposes.
Nearby Listings
Nearby Listings focuses on the most relevant local competition.
PriceLabs analyzes nearby properties with similar characteristics and presents a hyperlocal view of pricing and occupancy trends.
This helps operators answer questions such as:
How are comparable properties performing?
Where am I positioned against nearby competitors?
Am I above or below market pricing?
Market Dashboards
Market Dashboards provide a broader view of the market.
These reports help operators understand:
Larger market trends
Seasonality patterns
Occupancy shifts
Long-term supply and demand changes
Revenue managers frequently use both tools together.
Nearby Listings helps guide tactical pricing decisions.
Market Dashboards help shape strategic decisions.
Always Start With Property Identity
One of the strongest themes throughout the training was property identity.
Before making any pricing decision, operators should understand what type of property they are managing.
Emile encouraged students to ask:
Is this a premium property?
Is it a budget-friendly listing?
Is it a top-performing property?
Does it offer unique amenities?
How does it compare to competitors?
These answers influence every pricing decision.
A top-performing property should not necessarily follow average market behavior.
Likewise, an average property should not automatically expect premium pricing.
Revenue management starts with understanding where a property fits within its competitive landscape.
Occupancy Tells a Story
Neighborhood Data becomes especially powerful when occupancy is analyzed alongside pricing.
Many operators focus heavily on ADR.
Revenue managers focus on context.
For example:
If market occupancy is projected to finish at 40%, pricing at the 90th percentile may not make sense.
If occupancy is strong and booking activity remains healthy, holding rates may be appropriate.
The session repeatedly emphasized evaluating:
Current occupancy
Historical occupancy
Year-over-year pacing
Seven-day pickup trends
Remaining inventory
These indicators help revenue managers determine whether a property is likely to book without significant intervention.
Market Pacing Is One of the Most Important Signals
Another major lesson involved market pacing.
Pacing compares current booking performance against historical patterns.
Revenue managers regularly ask:
Are we ahead of last year?
Are we behind last year?
Is the market ahead or behind?
Are bookings still actively coming in?
A market that is pacing behind but still showing healthy pickup may require patience.
A market that is pacing behind with little booking activity may require action.
Without pacing data, operators risk reacting emotionally rather than strategically.
Neighborhood Data provides the visibility needed to make informed decisions.
Revenue Management Is About Pulling the Right Lever
One of the most valuable takeaways from the session was that lowering prices is not always the answer.
When performance lags, revenue managers consider multiple options.
Possible adjustments include:
Lowering rates
Reducing minimum stays
Applying length-of-stay discounts
Creating adjacency-day rules
Improving visibility
Adjusting booking restrictions
As Emile explained, every lever should be evaluated based on what the data is showing.
The goal is not simply generating bookings.
The goal is generating the highest possible RevPAR while maintaining healthy occupancy.
Neighborhood Data Helps With Future Planning Too
Most operators use data reactively.
Revenue managers use it proactively.
During the session, Adam demonstrated how Neighborhood Data can be used to evaluate future peak seasons, including summer 2026 pricing.
Rather than blindly accepting system-generated prices, operators can compare:
Historical ADR
Historical occupancy
Revenue performance
Future pricing recommendations
This allows operators to identify situations where pricing may have drifted too high or too low.
Future pricing should always be grounded in realistic revenue targets.
Pair Neighborhood Data With Portfolio Analytics
One important lesson from the session was that Neighborhood Data should not be used alone.
Revenue managers often move between:
Neighborhood Data
Portfolio Analytics
Booking Insights
Historical Revenue Reports
Together, these tools provide a complete picture.
Neighborhood Data helps explain market behavior.
Portfolio Analytics helps explain business performance.
Combining both creates better revenue decisions.
The Best Revenue Managers Reevaluate Constantly
Revenue management is not a one-time activity.
It is an ongoing process.
Throughout the session, Emile and Adam emphasized the importance of regular touchpoints and continuous evaluation.
Revenue managers constantly review:
Occupancy
Booking pace
Market trends
Future demand
Revenue targets
Every adjustment is measured.
Every booking is evaluated.
Every result informs the next decision.
That discipline is what separates professional revenue management from simple pricing adjustments.
Final Thoughts
Neighborhood Data is one of the most valuable tools available to short-term rental operators.
Used correctly, it provides much more than pricing information.
It helps operators:
Understand market behavior
Track occupancy trends
Monitor booking pace
Evaluate future demand
Make better revenue decisions
The best revenue managers do not rely on intuition alone.
They rely on data, context, and a clear understanding of how the market is behaving.
And that process often starts with Neighborhood Data.
Key Takeaways
Neighborhood Data is a decision-making tool, not just a reporting tool
Nearby Listings and Market Dashboards serve different purposes
Property identity should guide pricing strategy
Occupancy and pacing provide critical market signals
Revenue managers focus on multiple levers beyond pricing
Future pricing should be grounded in revenue targets
Portfolio Analytics complements Neighborhood Data
Continuous evaluation leads to stronger revenue performance


